42 Sands Capital Meta Platforms Trades
Sands Capital acquired 1.99 Million Meta Platforms shares worth $942 Million. That's 2.61% of their equity portfolio (14th largest holding). The first Meta Platforms trade was made in Q2 2013. Since then Sands Capital bought shares eight more times and sold shares on 33 occasions. The stake costed the investor $495 Million, netting the investor a gain of 90% so far.
News about Meta Platforms Inc - Ordinary Shares - Class A and Sands Capital

SPAC King Chamath Palihapitiya Shares Key Insights For Success With AI Developers Seeking ''Product Market Fit''
Chamath Palihapitiya , the billionaire investor and former Facebook executive, has advised developers to consider using Groq Inc.’s AI models to enhance thei...
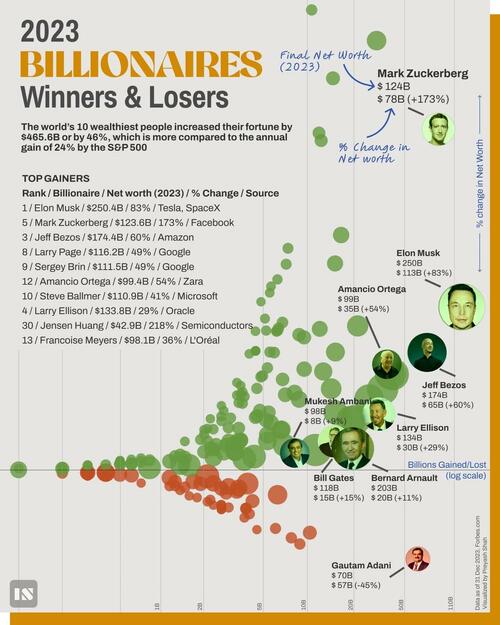
Billionaire Wealth: The Biggest Winners (& Losers) In 2023
Billionaire Wealth: The Biggest Winners (& Losers) In 2023 In early February, Mark Zuckerberg added $28 billion to his wealth in a matter of hours as Meta’s ...

Would You Still Want to Acquire Meta Platforms (META) Shares?
White Brook Capital Partners, an investment management firm, released its third quarter 2023 investor letter, a copy of which can be downloaded here. White B...

Meta''s ''Goldilocks Quarter'' Delights Analysts: ''This Is A Stock That Continues To Go Higher''
Meta Platforms, Inc. (NASDAQ: META ) ticked all the boxes with its first-quarter results — with top and bottom lines as well as key operational metrics outpe...