34 Sands Capital Taiwan Semiconductor Manufacturing Trades
Sands Capital's position in Taiwan Semiconductor Manufacturing is currently worth $798 Million. That's 2.22% of their equity portfolio (20th largest holding). The first Taiwan Semiconductor Manufacturing trade was made in Q3 2015. Since then Sands Capital bought shares 21 more times and sold shares on twelve occasions. The stake costed the investor $417 Million, netting the investor a gain of 92% so far.
News about Taiwan Semiconductor Manufacturing - ADR and Sands Capital
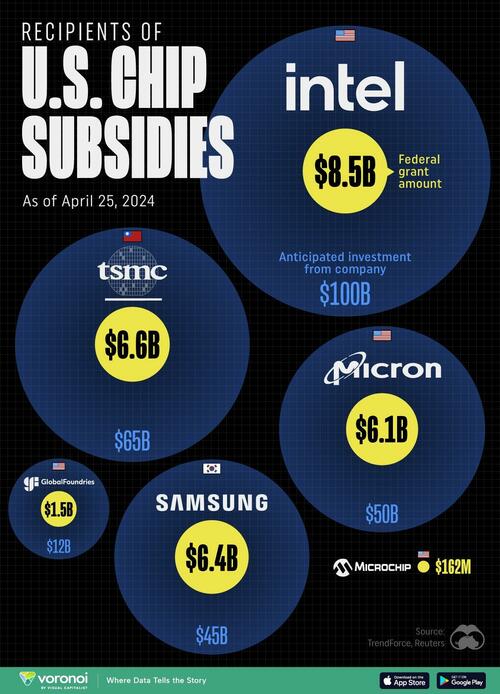
''Intel Insidious'' - Here''s All The ''Grants'' Given By Biden''s US CHIPS Act
''Intel Insidious'' - Here''s All The ''Grants'' Given By Biden''s US CHIPS Act This visualization shows which companies are receiving grants from the U.S. C...
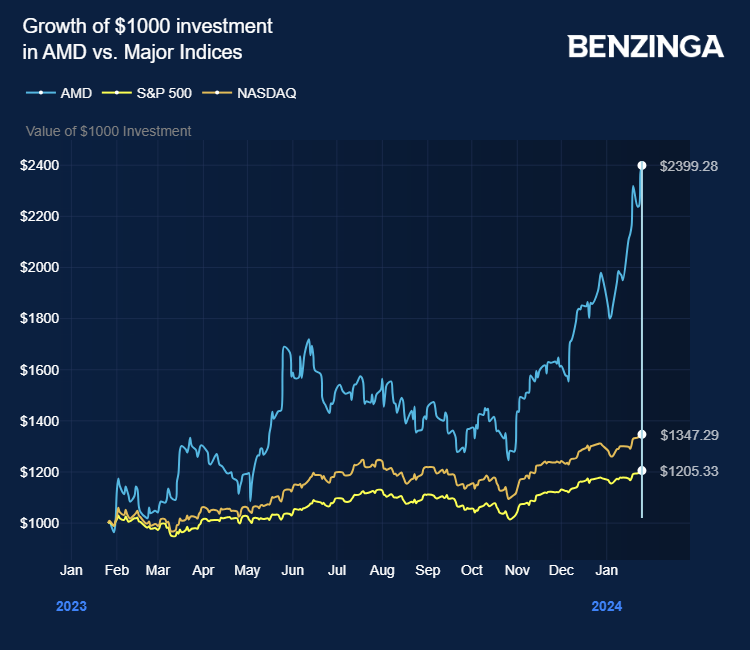
What''s Going On With Nvidia and AMD Stocks Friday?
Nvidia Corp (NASDAQ: NVDA ) and Advanced Micro Devices, Inc (NASDAQ: AMD ) stocks are trading lower Friday amid reports of Bill Baruch, President and COO of ...

G&S Capital LLC Has $2.35 Million Holdings in Taiwan Semiconductor Manufacturing Company Limited (NYSE:TSM)
G&S Capital LLC boosted its holdings in shares of Taiwan Semiconductor Manufacturing Company Limited (NYSE:TSM – Free Report) by 80.7% in the third quarter, ...

Birch Capital Management LLC Raises Stake in Taiwan Semiconductor Manufacturing Company Limited (NYSE:TSM)
Birch Capital Management LLC raised its stake in Taiwan Semiconductor Manufacturing Company Limited (NYSE:TSM – Free Report) by 58.4% in the 3rd quarter, acc...