Current Value of Holding

$0

Shares

0

% of Portfolio

0.00%

Average Buy Price

$66.7

Avg closing price
Price range

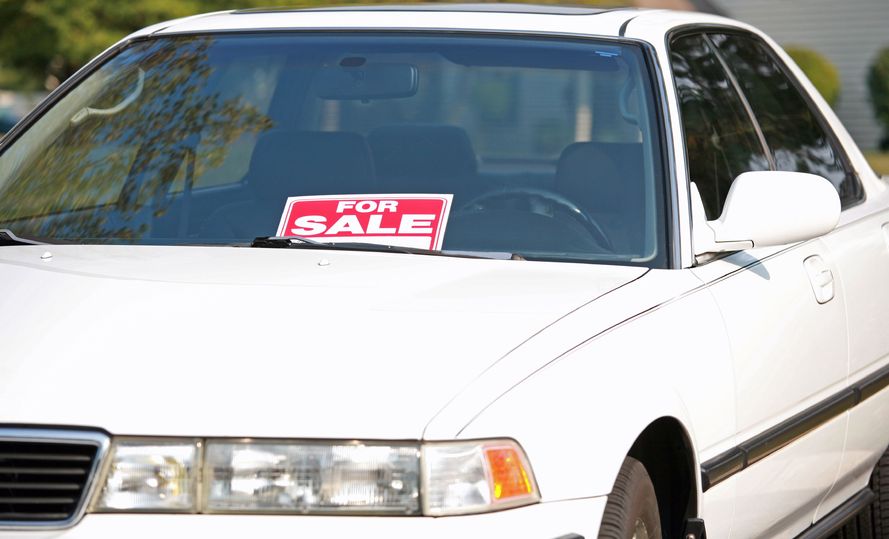
31 Paul Tudor Jones II Carmax Trades

Paul Tudor Jones II's position in Carmax is currently worth $947 Thousand. That's 0.01% of their equity portfolio (867th largest holding). The first Carmax trade was made in Q2 2013. Since then Paul Tudor Jones II bought shares 22 more times and sold shares on 24 occasions. The stake costed the investor $905 Thousand, netting the investor a gain of 4.7% so far.

Avg closing price
Price range
Sold -52.5 Thousand shares Q1 2024
Avg closing price $75.64
Price range $67.45 - $87.11
Increased shares by 29.0% (+11.8 Thousand shares) Q4 2023
Avg closing price $67.22
Price range $60.39 - $78.55
Sold 69.6% shares (-93 Thousand shares) Q3 2023
Avg closing price $81.89
Price range $69.01 - $85.83
Sold 43.2% shares (-102 Thousand shares) Q2 2023
Avg closing price $73.21
Price range $62.44 - $86.21
Increased shares by 1160.4% (+217 Thousand shares) Q1 2023
Avg closing price $66.93
Price range $56.26 - $79.32
New holding (+18.7 Thousand shares) Q4 2022
Avg closing price $64.20
Price range $55.69 - $74.58
Sold -96.8 Thousand shares Q2 2022
Avg closing price $94.04
Price range $85.76 - $103.17
Increased shares by 8.6% (+7.67 Thousand shares) Q1 2022
Avg closing price $107.57
Price range $96.48 - $127.01
New holding (+89.1 Thousand shares) Q4 2021
Avg closing price $140.03
Price range $122.54 - $154.85
Sold -7.23 Thousand shares Q3 2021
Avg closing price $133.08
Price range $124.24 - $146.45
Sold 35.3% shares (-3.94 Thousand shares) Q2 2021
Avg closing price $123.63
Price range $113.16 - $137.90
Sold 52.3% shares (-12.2 Thousand shares) Q1 2021
Avg closing price $121.72
Price range $93.30 - $135.83
Increased shares by 73.1% (+9.88 Thousand shares) Q4 2020
Avg closing price $93.77
Price range $86.44 - $100.46
Sold 34.5% shares (-7.12 Thousand shares) Q3 2020
Avg closing price $99.89
Price range $86.23 - $108.80
Increased shares by 4.2% (+836 shares) Q2 2020
Avg closing price $78.36
Price range $48.60 - $98.35
Sold 71.9% shares (-50.7 Thousand shares) Q1 2020
Avg closing price $84.61
Price range $44.27 - $101.90
Sold 43.6% shares (-54.4 Thousand shares) Q4 2019
Avg closing price $94.07
Price range $84.65 - $100.15
Increased shares by 109.4% (+65.3 Thousand shares) Q3 2019
Avg closing price $85.82
Price range $79.53 - $91.34
New holding (+59.6 Thousand shares) Q2 2019
Avg closing price $78.21
Price range $69.07 - $86.86
Sold -22.5 Thousand shares Q4 2018
Avg closing price $66.00
Price range $56.72 - $73.69

News about Carmax Inc and Paul Tudor Jones II

Embed chart

Easily embed the chart on your blog or website – it will always update automatically!